
Understand the Poission Distribution
Published:
The Poisson probability distribution is used to model the number of times an event happens in a fixed period of time or space. It is useful when events occur independently and at a constant average rate. This distribution is widely applied in areas like call centers, traffic flow, biology, and machine learning.
In this post, we will explain the Poisson distribution in simple terms, give real-world examples, and show how to visualize and code it without relying on heavy third-party libraries.
What is the Poisson Distribution?
The Poisson distribution describes the probability of observing a certain number of events in a fixed period, given an average event rate \(\lambda\). The formula is:
\[P(X = k) = \frac{e^{-\lambda} \lambda^k}{k!}\]where:
- \(P(X = k)\) is the probability of exactly \(k\) events happening.
- \(\lambda\) is the average number of occurrences.
- \(k\) is the number of events (must be a non-negative integer).
- \(e\) is approximately 2.718.
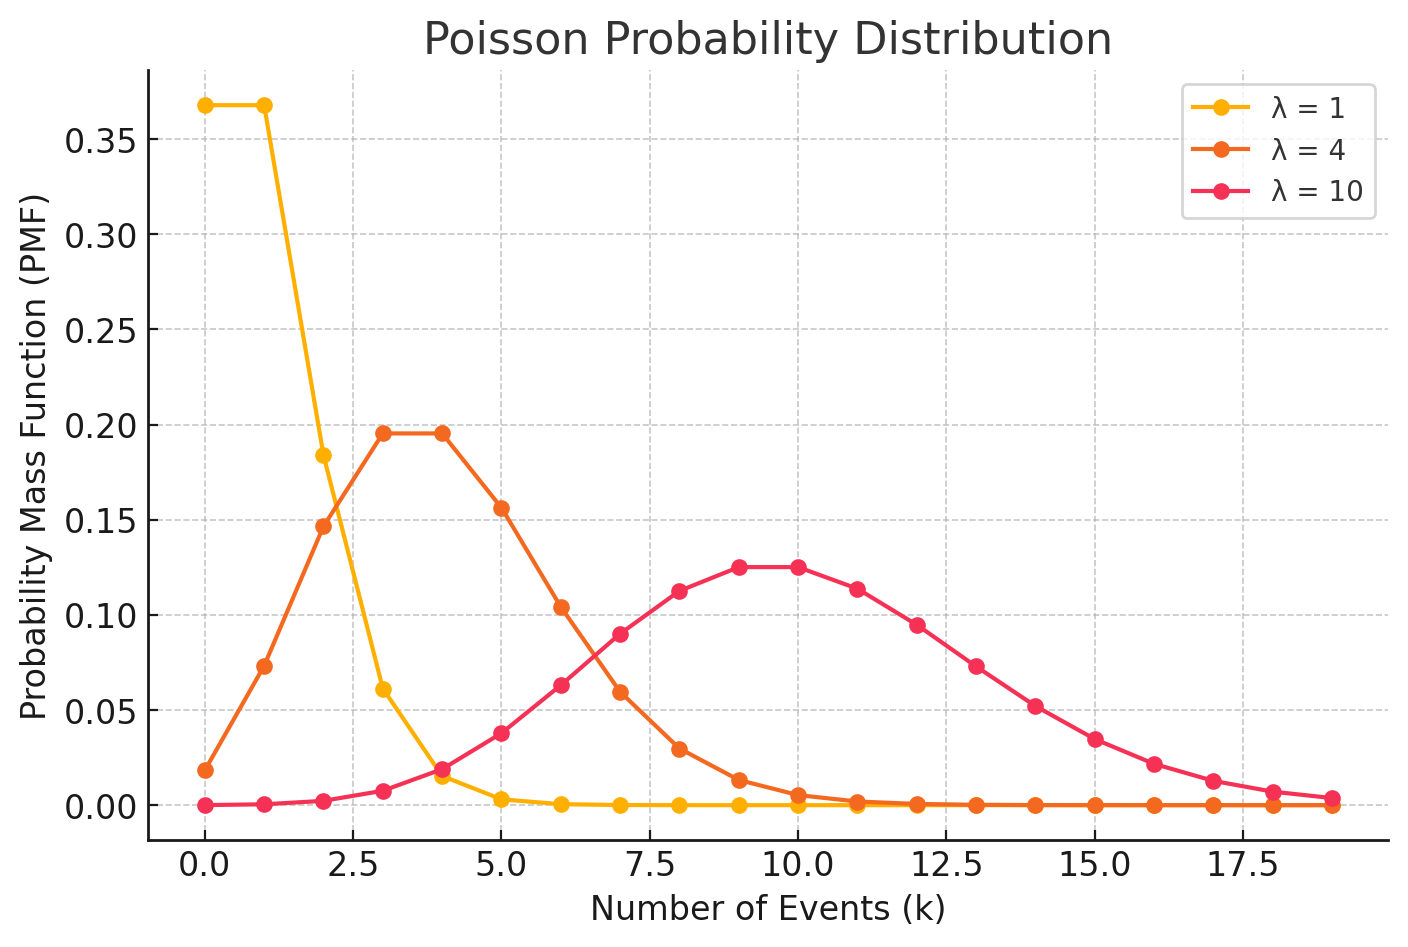
This graph shows that when \(\lambda\) is small, the distribution is skewed, but as \(\lambda\) increases, it becomes more symmetric.
Intuitive Understanding of \(\lambda\) and \(k\)
To understand \(\lambda\) and \(k\), consider these examples:
- Customer Arrivals at a Store
- A shop receives \(\lambda = 10\) customers per hour on average.
- The Poisson model helps estimate the chance of exactly \(k = 8\) or \(k = 12\) customers arriving in an hour.
- Emails Received per Hour
- A person gets \(\lambda = 5\) emails per hour on average.
- The Poisson model predicts how likely it is to receive \(k = 2\) or \(k = 7\) emails in a given hour.
- Bus Arrivals at a Station
- If a bus arrives every 15 minutes on average, then in an hour, \(\lambda = 4\) buses are expected.
- The model estimates the probability of exactly \(k = 3\) or \(k = 5\) buses arriving in an hour.
Learn with Coding: Poisson Simulation
A simple way to see the Poisson distribution in action is by simulating it. Here’s how you can generate Poisson-distributed random numbers without heavy third-party libraries:
import numpy as np
import matplotlib.pyplot as plt
import math
def poisson_simulation(lam, n):
samples = [] # List to store simulated Poisson-distributed values
for _ in range(n): # Generate 'n' Poisson samples
k, p = 0, 1 # Initialize k (event count) and p (probability product)
exp_lambda = math.exp(-lam) # Compute e^(-λ), which is a threshold
while p > exp_lambda: # Keep generating until p falls below this threshold
p *= random.uniform(0, 1) # Multiply p by a new uniform random number
k += 1 # Increase the event count
samples.append(k - 1) # Store the sample (subtract 1 because loop overshoots)
return samples # Return all generated samples
# Simple example
samples = poisson_simulation(lam=5, n=10)
print(samples) # Example output [3, 4, 6, 7, 5, 5, 4, 3, 8, 5]
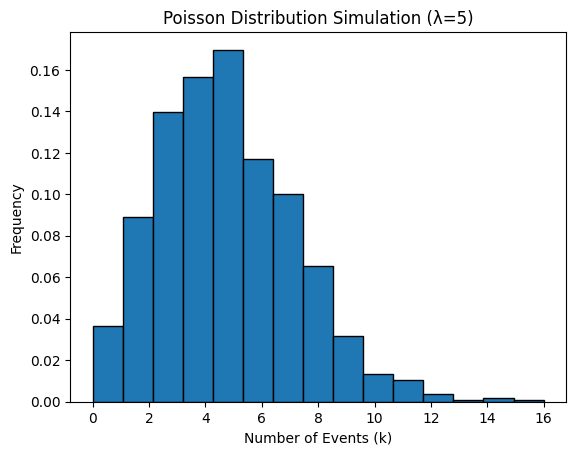
# Simulate 1000 events with λ = 5
samples = poisson_simulation(5, 1000)
# Plot histogram
plt.hist(samples, bins=15, edgecolor='black', density=True)
plt.xlabel('Number of Events (k)')
plt.ylabel('Frequency')
plt.title('Poisson Distribution Simulation (λ=5)')
plt.show()
Conclusion
The Poisson distribution is a simple yet powerful tool for modeling events in a fixed interval. By adjusting \(\lambda\), we can estimate how likely it is for a specific number of events to occur. We explored:
- The formula and meaning of \(\lambda\) and \(k\).
- Intuitive examples to build understanding.
- A graph of the Poisson distribution.
- A Python implementation of Poisson simulations.
Mastering the Poisson distribution can help in fields like business analytics, network traffic analysis, and artificial intelligence.
Further Reading
- Poisson Distribution - Wikipedia
- Poisson Regression - An Introduction
- Python Implementation of Poisson Distribution
🤖 Disclaimer: This post is inspired by Educative.io AI learning course, and generated with AI-assisted but reviewed and refined by Dr. Rebecca Li, blending AI efficiency with human expertise for a balanced perspective.